Detour File Map Visualization
The endpoint /detour/file/{fileid}/geojson returns a GeoJSON representation of detour files, allowing you to visualize them on any GeoJSON-compatible map.
GeoJSON Structure
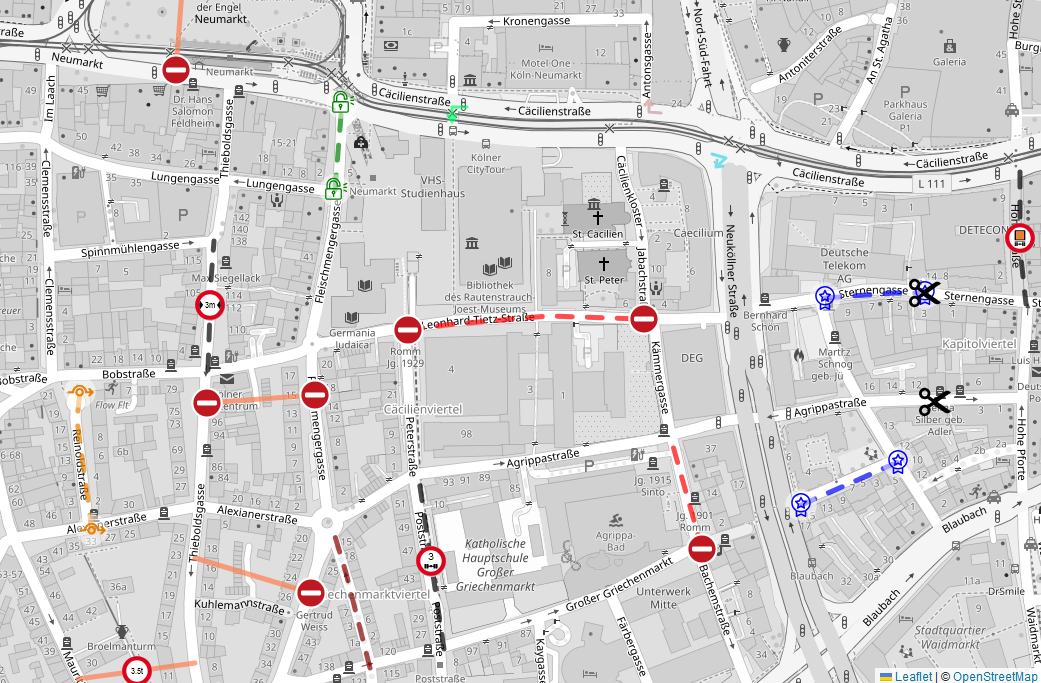
The response contains a FeatureCollection with two types of features for each detour edit:
- LineStrings: Represent road segments
- Points: Represent traffic symbols (e.g., "No through traffic" signs)
Style Properties
In addition to the geometry and the detour attributes, the features also contain attributes for the display:
| Property | used by | indicates |
|---|---|---|
| stroke | LineString | Color for the line |
| stroke-width | LineString | Width for the line |
| stroke-dasharray | LineString | If a line should be a dashed line, and pattern definition |
| icon-data | Point | Graphic for this point as a data URI with an SVG |
| icon-width | Point | Width of the symbol in px |
| icon-height | Point | Height of the symbol in px |
Implementation Note
These styling properties are custom extensions to the GeoJSON standard. Most mapping APIs will not automatically apply these styles - you'll need to write custom styling functions based on your mapping API's documentation.
Example Implementation
Below is an example of how to apply these styles in LeafletJS. Assuming FILE contains the ID of your file, TOKEN is a valid JWT token of your account, and map is a Leaflet map, you can use this code:
1 2 3 4 5 6 7 8 9 10 11 12 13 14 15 16 17 18 19 20 21 22 23 24 25 26 27 28 29 30 31 32 33 34 35 36 37 38 39 40 | |